Hello, my name is Simeon. I joined Birmingham Museums Trust (BMT) at the end of October just before the reopening of the Birmingham Museum & Art Gallery round room, Industrial Gallery, Bridge Gallery, Tearoom, and Museum Shop, plus a new family gallery. A very busy time for all BMT sites as they geared up for the autumn half term.
My role is User Insights and Reporting Co-ordinator and one of my key focuses since joining BMT has been understanding the data we collect, how we collect it and how we use it. In my first few weeks the opportunity to automate data collection from Shopify was brought up and I set my sights on implementing this.
At BMT we use Shopify for all ticket, Retail and Food and Beverage (F&B) sales and every week many different staff members input data from Shopify into our master excel document. Taking up their valuable time and giving us the opportunity to introduce human error, as we all do. I hadn’t used Shopify before so started getting to grips with its systems and unique quirks.
Scope
For the first iteration I decided on automating Retail and F&B data.
For our reporting on ticketing, we report visitor numbers on the day the visitor attends a site, which for advanced sales is not on the day they purchased a ticket. Shopify does record this information but accessing the line item properties will require some extra steps, so I opted to not include ticket sales in the first iteration of Shopify data automation. It was also important that this fitted into our existing data architecture.
Easy as 1, 2, 3. .. 4, 5, 6…
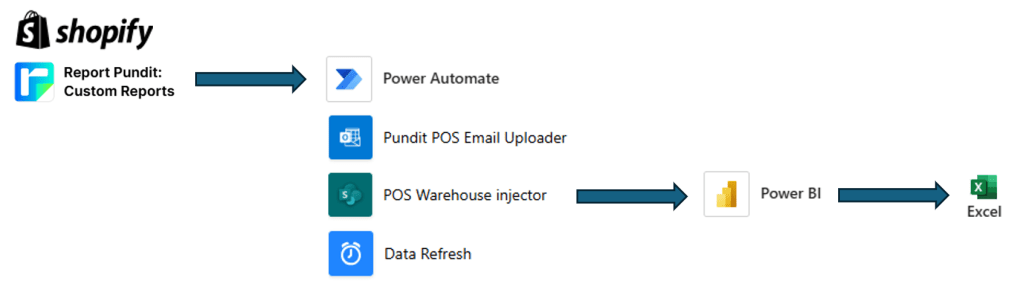
To get the data out of Shopify we used Report Pundit, a Shopify app that allows you to build and automate custom reports. Pundit creates a sales report of all retail and F&B sales across all our sites and emails this as an Excel file on a daily basis to an outlook inbox.
From there Power Automate takes over and uploads the attached report to SharePoint and adds the data from this report into a Data Warehouse, also on SharePoint.
A Power BI report then uses DAX measures to transform and filters the data leaving us with our KPIs separated by each site. We also did calculations at this stage to get Average Basket Size and filtered by product type to report income streams separately.
And finally, our master excel document gets the data from Power BI and we XLOOKUP the values into our existing reporting structure and Power Automate triggers a data refresh script.
This all happens automatically overnight, so by the time our team log in in the morning the previous day’s data is in place.
You may be thinking, that’s quite long winded and has a few steps that could be removed or streamlined to more efficiently handle this. And you probably would be right! But for a first attempt (ignoring the twenty or so failed flows) it works, and that’s good enough for now, safe enough to try.
But is the data correct? We have been monitoring this frequently since its introduction at the start of February. For retail, yes data has been matching the data on Shopify that the team would have previously entered manually. However, for F&B we have had some days with discrepancies, so it needs further investigation to find the root cause. For now, this is being corrected manually.
I didn’t think about this at the time, but several colleagues asked if making changes to Shopify analytics reports would be problematic for the automated data. Thankfully not, as the Pundit reports are separate from the Shopify analytics reports, so changes to one do not affect the other.
Overall, the project has already delivered some time savings, improved data accuracy and reduced manual work, but we’re far from done. There’s always room for improvement, and we’ll continue refining the process to make it as efficient and reliable as possible.
Simeon Liley, Birmingham Museums Trust

Leave a comment